Energy system model 
Rationale and model focus 
The employed energy system model (ESM) is based on the energy system modeling framework oemof-solph [27] . The model comprises the electricity and heat sector of ABW at municipal-level at a temporal resolution of 1 hour. It is formulated as a linear optimization problem with the objective of minimizing the cost for operation, CO2 emission allowances and grid extension.
Grid model 
The transmission capacities between the municipalities are given by the extra high voltage (380 kV) and high voltage grid (110 kV) as shown in Fig. 3 ; its topology and parameters were taken from [28] , [29] . This allows for a realistic assessment of the intra-regional exchange and grid load as well as the identification of potential congestions on those voltage levels.
Subsequently, the electrical generation and demand of the municipalities are allocated to high voltage (HV) / medium voltage (MV) transformer stations. The allocation is done as follows:
-
Municipality contains no HV/MS station: electric components are connected to the closest station available
-
Municipality contains 1 HV/MS station: electric components are connected to this station
-
Municipality contains >1 HV/MS stations: all electric components are evenly distributed to stations
Although the national grid is not explicitly modeled, it is used for power exchange by municipalities without direct connection to the regional grid. Imports and exports are facilitated by using virtual sources and sinks located at 9 cross-regional links to the national grid.
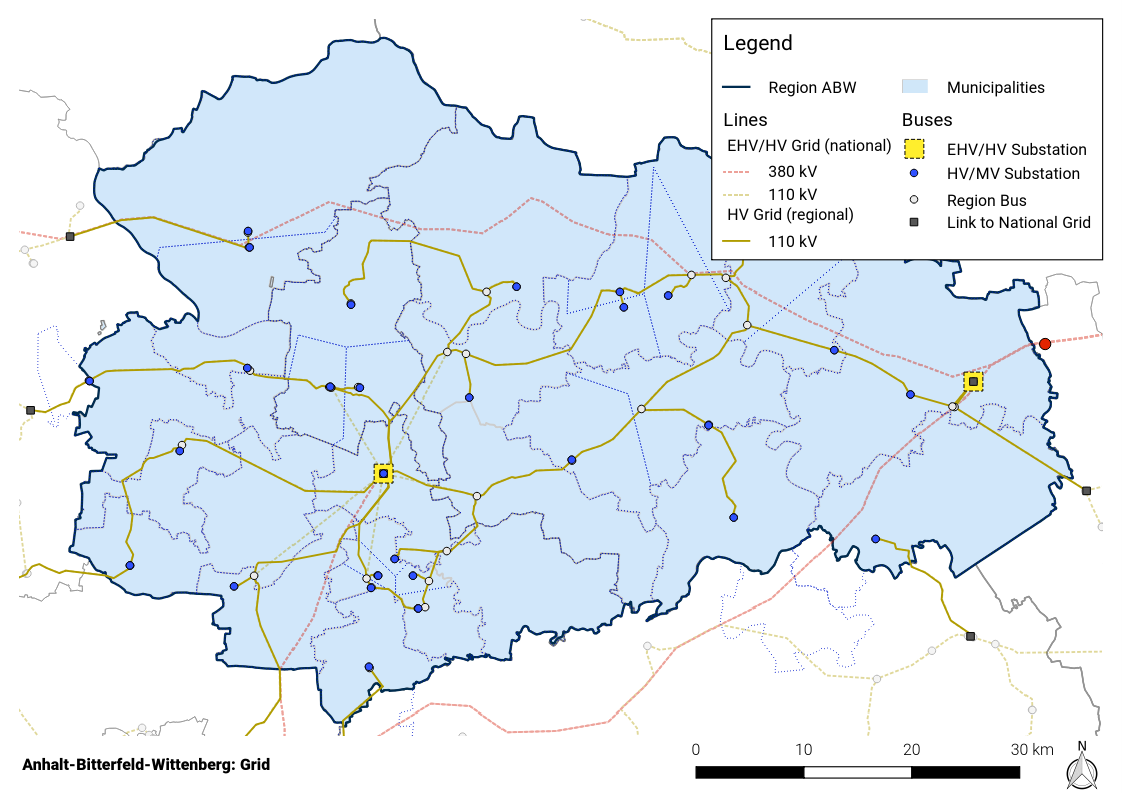
Fig. 3 Extra high voltage and high voltage grid of ABW with cross-regional links to the national grid 
Medium and low voltage distribution grids are not part of the grid model. District heating networks are not explicitly modelled but the heat demand of connected consumers is taken into account.
Generation and demand 
On the electrical generation side, wind turbines, ground-mounted PV, roof-mounted PV, biogas plants, run-of-river plants, combined-cycle gas turbines (CCGT), and simple-cycle gas turbines (SCGT) have been integrated as the most important technologies in the region. The heat generation includes decentralized conventional heating systems primarily based on natural gas, wood, and fuel oil. Four large district heating networks are located in the region which are fed by CCGT, large CHP units, and gas-fired boilers. Small networks are not part of the model. The electrical and heat demand incorporates the residential, commercial, trade, services (CTS) and agricultural sector; for the industrial sector, only the electricity side is included. On the flexiblity side, the model integrates households with demand-side management, battery storages, and power-to-heat (heat pumps and electrical boilers). Fig. 4 shows the model’s components.
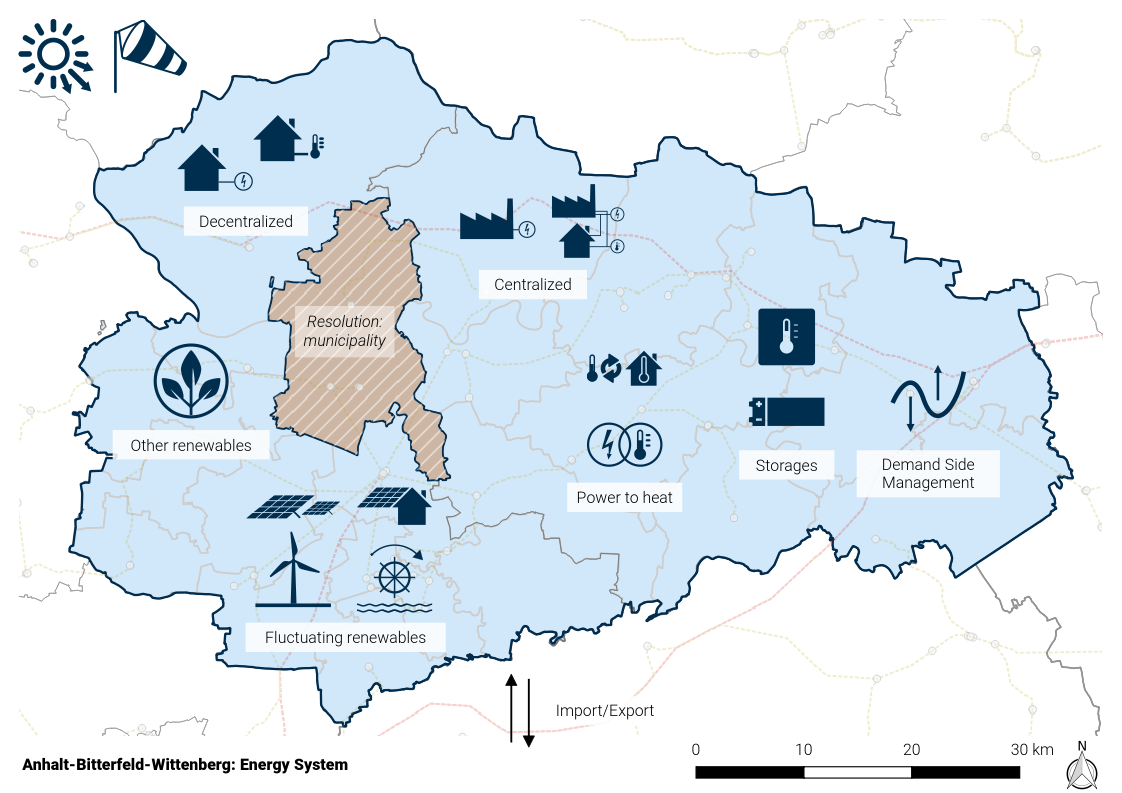
Fig. 4 Components of regional energy system model 
Fluctuating renewables 
The model includes georeferenced data on wind turbines, ground-mounted PV, roof-mounted PV, biogas plants, and run-of-river plant data of 2017 from the OPSD project [30] , [31] .
Wind turbines 
-
Installed nominal power (2017): 717 MW
-
Wind turbine models for the status quo (2017) are chosen according to the largest manufacturers in Germany in terms of market share [32] . Typical turbines of the two market leaders Enercon (40 %) and Vestas (24 %) that have been used are E-82 (85 m and 98 m hub height), E-115 (122 m hub height), V90 (80 m and 100 m hub height), and V112 (119 m hub height). The individual turbine types were sorted into 2 classes <2.5 MW (87 %) and >2.5 MW (13 %) based on the installed types as of today (cf. above). The 6 types were weighted by market share.
-
For both future scenarios, a single turbine model (Enercon E-141, hub height of 159 m)
-
Feedin timeseries are generated by reegis [33] which uses Coastdat-2 weather data [34] (weather year 2013).
-
To account for annual variations, the data is scaled to match the mean annual full load hours in Saxony-Anhalt for 2011-2015 of 1630 h given by [35] .
Photovoltaics 
-
Installed nominal power of ground-mounted systems (2017): 445 MW
-
In the OPSD dataset [30] there’s no information of the type of PV system (roof or ground-mounted). Based upon typical values [36] plants with a nominal power of <=300 kWp area treated as rooftop systems, larger plants as ground-mounted systems.
-
Feedin timeseries are generated by renewables.ninja [37] which uses generic PV models and CM-SAF SARAH irradiation data [38] (weather year 2015).
-
To account for annual variations, the data is scaled to match the mean annual full load hours in Saxony-Anhalt for 2011-2015 of 998 h given by [39] .
Biomass and biogas plants 
Run-of-river plants 
-
A constant feedin is assumed with 3833 annual full load hours (2012-2017 mean from [41] )
Conventional power plants 
There are a couple of fossil-fueled CHP power plants which are included in the model; data from OPSD project [42] is used. Those plants feed into district heating systems as described in District heating .
Electricity and heat demand 
Energy demand today 
The annual electricity demand for each sector (residential, commercial, trade, services, agricultural and industrial) and municipality is taken from [43] and allocated to the HV/MV stations. The hourly profiles are calculated in different ways:
-
Households: data from [44]
-
Commercial, trade, services (CTS) and agricultural: standard load profiles (SLP G0) using the demandlib [45]
-
Industrial sector: band-like profile using the demandlib [45]
The annual heat demand for space heating and hot water for each sector and municipality is determined as follows:
-
Households: based on the number of buildings and living spaces from [46] and [47] , heat demands are calculated per municipality using building-specific consumptions from [48] and [49] . The year of construction, unoccupancy rates and type of building (single or multi-family house) are taken into account. Time series are created with the demandlib [45] using standard gas load profiles HEF and HMF . Furthermore, historical ambient temperature profiles from the closest DWD survey station [50] are incorporated.
-
Commercial, trade, services (CTS) and agricultural: for these sectors, only the energy required for space heating and drinking water (no process heat) is taken into account. The definition of economic brnaches conform to the classification WZ2008 by the German Federal Statistical Office [51] is used. For each branch, specific consumption values (mostly per employee, data from [52] ) are used from [53] to calculate annual demands per municipality. As for households, time series are created with the demandlib [45] but based upon the standard gas load profile GHD for CTS.
The results for electricity and heat demand for the status quo are shown below:
|
Municipality |
Heat demand households [MWh] |
Heat demand CTS [MWh] |
|
|---|---|---|---|
|
15001000 |
Dessau-Roßlau |
564600 |
185869 |
|
15082005 |
Aken (Elbe) |
69293 |
5149 |
|
15082015 |
Bitterfeld-Wolfen |
274941 |
64401 |
|
15082180 |
Köthen (Anhalt) |
184570 |
43520 |
|
15082241 |
Muldestausee |
97377 |
9488 |
|
15082256 |
Osternienburger Land |
74155 |
7038 |
|
15082301 |
Raguhn-Jeßnitz |
80701 |
10351 |
|
15082340 |
Sandersdorf-Brehna |
115050 |
13115 |
|
15082377 |
Südliches Anhalt |
111048 |
18387 |
|
15082430 |
Zerbst/Anhalt |
166584 |
24588 |
|
15082440 |
Zörbig |
74430 |
14921 |
|
15091010 |
Annaburg |
58476 |
7623 |
|
15091020 |
Bad Schmiedeberg |
70408 |
9283 |
|
15091060 |
Coswig (Anhalt) |
100068 |
16148 |
|
15091110 |
Gräfenhainichen |
94467 |
12356 |
|
15091145 |
Jessen (Elster) |
110480 |
16097 |
|
15091160 |
Kemberg |
84992 |
10182 |
|
15091241 |
Oranienbaum-Wörlitz |
71842 |
14087 |
|
15091375 |
Wittenberg |
349316 |
79232 |
|
15091391 |
Zahna-Elster |
79525 |
10838 |
Energy demand in future scenarios 
In 2035 and 2050, a reduction of electricity and heat demand is assumed due to building renovation and demographic change. Other aspects such as changes in devices’ efficiencies or consumers’ behavior is not taken into account.
-
For the heat demand , an annual renovation rate is used to determine the total renovation quantity for the target years:
-
residential buildings: 1.0 % for 2017-2024, 1.6 % for 2025-2034, 2.0 % for 2035-2044, and 2.5 % for 2045-2050 [54] . This results in a total renovation rate of 24 % in 2035 and 56.2 % in 2050.
-
non-residential buildings: 1.3 % for 2017-2024, 2.15 % for 2025-2034, 2.7 % for 2035-2044, and 3.4 % for 2045-2050. This results in a total renovation rate of 31.9 % in 2035 and 75.9 % in 2050.
-
-
The reduction of heat demand in renovated buildings is based upon the following renovation scenarios. The average of all three scenarios per sector is used as reduction rate in the model:
-
conventional (“konventionell” [48] ): single- and multi-family households -33 %, CTS -33 %
-
fully renovated (“vollsaniert” [55] ): single-family households -52 %, multi-family households -56 %, CTS -44 %
-
fully renovated+ (“vollsaniert+” [55] ): single-family households -69 %, multi-family households -68 %, CTS -60 %
-
-
Moreover, a decrease in electricity and heat demand due to depopulation and decline in employment is taken into account (data from [56] , [57] ).
-
2035: population 307,877 (-16.8 %), employees 73,535 (-10.6 %)
-
2050: population 275,411 (-25.6 %), employees 65,588 (-20.2 %)
-
-
The electricity demand of the CTS sector results from the specific consumption per employee from [54] .
-
The reduction rate for industrial electricity demand is derived from the reference studies of the Scenarios ( [58] , [59] ) and amount to -23 % in 2035 and -20 % in 2050 [59] .
Using these considerations the final energy reductions are as follows:
Electricity
-
2035: households -17 %, CTS -23 %, industry -23 %
-
2050: households -26 %, CTS -20 %, industry -20 %
Heat
-
2035: households -13 %, CTS -14 %, (industrial heat is not part of the model)
-
2050: households -31 %, CTS -33 %, (industrial heat is not part of the model)
Centralized and decentralized heat systems 
The total heat demand described above is split into centralized (district heating) and decentralized systems. The four largest district heating networks are located in Dessau-Roßlau, Bitterfeld-Wolfen, Köthen and Wittenberg. The municipal energy suppliers provided load profiles for different years [60] which were temperature-corrected to profiles valid for 2017. This results in the following district heating shares: Dessau-Roßlau 42 %, Bitterfeld-Wolfen 15 %, Köthen 9 % and Wittenberg 20 %. Subsequently, the remaining heat demand is allocated to decentralized consumers.
District heating 
System configuration in the four district heating networks:
- Dessau-Roßlau
- Bitterfeld-Wolfen, Köthen, Wittenberg
-
-
Combined heat and power (CHP) plants
-
Gas-fired boilers
-
As there’s no further information on the feeding plants available, the following method is used to estimate the plant configuration:
- Dessau-Roßlau
-
-
CCGT (dispatchable) to cover the base load with a min. share of 80 % in heat demand [63] , [64] . This constraint is needed as subsidies for power and heat cogeneration are not included in the revenues generated by this plant. Therefore the dispatch would be disencouraged resulting in a smaller annual energy output. ( oemof component: ExtractionTurbineCHP )
-
Gas-fired boilers (dispatchable) cover the peak loads. ( oemof component: Transformer )
-
- Bitterfeld-Wolfen, Köthen, Wittenberg
-
-
CHP plants cover (dispatchable) the base load. Analyzing the annual load duration curves of the grids [60] shows that an installed power of 17 % of the peak load is reasonable tradeoff between installed power and utilization of a unit. With this assumption, more than 40 % of the annual demand can be met. ( oemof component: Transformer )
-
Gas-fired boilers (dispatchable) cover the peak loads ( oemof component: Transformer )
-
- Notes
-
-
The electric energy produced by all feeding power units is fed into the closest MV/MV station.
-
Further parameters are taken from [65] .
-
Decentralized Heating systems 
Date on technology shares in the decentralized heating systems for households in the status quo scenario are obtained from demandRegio [66] on a district resolution. For the CTS and agricultural sector, data on federal state resolution from [41] is used. It is assumed that these shares also apply for the underlying municipalities. Per municipality, for each technology (natural gas, fuel oil, wood, coal, solar thermal, night storage heating, ambient_heat) one generator ( oemof components: Source and Transformer ) is created, feeding into the decentral heat bus (see Model details ). Model parameters are obtained from [67] . Except for ambient_heat, which is provided by heat pumps in the model and a flexible generation, all of the above sources are fixed generators whose feedin follow the heat demand with its respective share. Energy generation of solar thermal systems is calculated using the normalized PV feedin timeseries.
For the future scenarios based upon NEP (2035) [58] and ISE (2050) [59] , [68] (cf. Scenarios ) different shares apply. The following table shows the configuration for all 3 scenarios/years per district:
|
Technology |
Share CTS |
Share households (Dessau-Roßlau) |
Share households (Anhalt-Bitterfeld) |
Share households (Wittenberg) |
|
|---|---|---|---|---|---|
|
Status quo (2017) |
natural gas |
79.8% |
69.2% |
67.2% |
69.2% |
|
fuel oil |
17.8% |
19.5% |
20.5% |
19.0% |
|
|
wood |
2.1% |
2.6% |
2.8% |
2.6% |
|
|
coal |
0.2% |
1.9% |
2.0% |
1.9% |
|
|
solar thermal |
0.2% |
0.1% |
0.1% |
0.1% |
|
|
night storage heating |
0.0% |
4.3% |
4.5% |
4.2% |
|
|
ambient_heat |
0.0% |
2.3% |
2.9% |
3.1% |
|
|
NEP 2035 |
natural gas |
59.0% |
59.0% |
59.0% |
59.0% |
|
fuel oil |
12.0% |
12.0% |
12.0% |
12.0% |
|
|
wood |
6.0% |
6.0% |
6.0% |
6.0% |
|
|
coal |
0.0% |
0.0% |
0.0% |
0.0% |
|
|
solar thermal |
4.0% |
4.0% |
4.0% |
4.0% |
|
|
night storage heating |
4.0% |
4.0% |
4.0% |
4.0% |
|
|
ambient_heat |
15.0% |
15.0% |
15.0% |
15.0% |
|
|
ISE 2050 |
natural gas |
5.0% |
5.0% |
5.0% |
5.0% |
|
fuel oil |
0.0% |
0.0% |
0.0% |
0.0% |
|
|
wood |
0.0% |
0.0% |
0.0% |
0.0% |
|
|
coal |
0.0% |
0.0% |
0.0% |
0.0% |
|
|
solar thermal |
8.0% |
8.0% |
8.0% |
8.0% |
|
|
night storage heating |
17.0% |
17.0% |
17.0% |
17.0% |
|
|
ambient_heat |
70.0% |
70.0% |
70.0% |
70.0% |
Methane 
In the future scenarios, some components still rely on natural gas such as CCGT and boilers. Aligned to the two underlying studies NEP (2035) [58] and ISE (2050) [59] , a fixed proportion of methane in the gas network is assumed (2035: 0 %, 2050: 100 %) affecting the emissions and operational cost of those components. Parameters are taken from [69] .
Further notes 
-
Energy generation of small (in-house) CHP units is neglected.
-
CCGT Bitterfeld: 110 MW(th), 110 MW(el) [70] . Electricity is fed into the HV grid. Heat is consumed by industrial sites only and therefore neglected (out of the model’s boundary, cf. section Generation and demand ).
Flexibility options 
As described earlier, the model integrates households with demand-side management, large-scale battery storages, and power-to-heat (heat pumps and electrical boilers) in decentralized heating systems and district heating networks. This section describes the underlying methods in detail, the resulting scenario parameters are listed in (cf. Scenarios ).
Demand-side management (DSM) 
A DSM model was developed and integrated as new component SinkDSM into oemof-solph . The component takes flexibility bands as input which were calculated in a bottom-up model by the Institut für ökologische Wirtschaftsforschung (IÖW). The methods are described in a supplementary report [44] . Abstract:
In a simulation, the potential of private households and businesses in the form of supermarkets was evaluated, which exists for flexible electricity consumption and which restrictions can be expected. The results were used to enable the Reiner Lemoine Institute to integrate and compare this potential for the regions Anhalt-Bitterfeld, Wittenberg and Dessau-Roßlau in its own simulations for the optimal scheduling of power plants, storage facilities and flexibilities. The simulation data are published as annual load profiles for the municipalities in the Anhalt region.
Batteries 
Batteries include large-scale units and home systems in terms of storage capacity. The capacity of large-scale battery storage is determined by scaling with installed RES capacity as described in Scenarios . Home systems’ total capacity is distributed based on small PV systems’ nominal capacity. For each type, an oemof GenericStorage component is created per municipality. The C-rate is estimated with 0.25 for large-scale and 0.68 for home systems [71] .
Power-to-heat 
Power-to-heat includes air source heat pumps (ASHP) and ground source heat pumps (GSHP) in decentralized heating systems and electrical boilers in district heating.
Heat pumps with thermal storages 
By 2035, for the NEP scenario, it is assumed that 15 % of the total heat demand is supplied by heat pumps. For the climate neutral scenario in 2050 it is estimated that 70 % of the total heat demand is covered by heat supply from heat pumps (cf. Decentralized Heating systems ).
In 2016, the share of small ASHP and GSHP was 50 % each according to [72] which is used to constrain the upper limit of thermal energy supplied in the model. In the component Transformer a quality grade of 0.4 [73] and a supply temperature of 40 °C is assumed. Using time series of ambient temperature (ASHP) and soil temperature (GSHP) from [50] the coefficient of performance (COP) for every time step is calculated. Additionally, icing losses of 20 % below 2 °C are taken into account for ASHP. This results in a mean seasonal performance (MSP) factor of 3.4 for ASHP and 4.3 for GSHP which are in accordance with typical values for 2016 [72] . For the future scenarios, the COP is linearly scaled up to match a MSP of 3.78 in 2035 and 4.3 in 2050 [74] .
A minimum storage capacity is required in heat pump systems to ensure fault-free operation (required due to minimum running times of compressor) as heat dissipation must be ensured at all times [75] . The default storage capacity without any measures to gain additional flexibility follows the installed heating elements of the system: buildings with underfloor heating are assumed to have a sufficient storage capacity, buildings with convection radiators (mainly affects retrofitted systems in the future scenarios) are assumed to have a capacity of 20 l/kW of installed heat pump power [75] .
As the different types of heating element are not modelled separately, a mean storage capacity is calculated based upon its share in renovated buildings; convection radiators account for 71 % and underfloor heating for 29 % [72] .
To facilitate flexible demands in household and CTS applications with heat pumps, additional thermal storages are required. The capacity for buffering is estimated with 60 l/kW of installed nominal heat pump power in the PTH scenarios, 100 l/kW in PTH+ scenarios, and 200 l/kW in PTH+ scenarios. Under consideration of the heating elements’ share from above, this results in 71.2 l/kW ( PTH ), 114.2 l/kW ( PTH+ ), and 228.4 l/kW ( PTH++ ) storage capacity. The C-rate is estimated with 6.7 [71] .
Electrical boilers with thermal storages 
Each of the four district heating networks (cf. Centralized and decentralized heat systems ) is equipped with large-scale electrical boilers to provide additional flexibility for the power system. The nominal power is defined as a fixed ratio of the annual peak load: 50 % in scenario PTH and 100 % in scenarios PTH+ and PTH++ .
The ratio of storage capacity (600 MWh) and annual peak load of Dessau’s heating system are used to estimate storage capacities for the other cities in the PTH scenarios (5 MWh/MW_peak). In the PTH+ and PTH++ scenarios, a value of 10 MWh/MW_peak is used. The existing storage in Dessau is retained in all scenarios. The C-rates are estimated with 0.1 [71] .
Autarky 
With the scenario dimension autarkic supply, it is investigated how region’s energy demand can be supplied under constrained imports of electricity. Autarky on annual balance of 80 % and 90 % is analyzed based in the in-depth investigation of regional autarky in RE based electricity supply by [76] . In the energy system model, this is achieved by limiting the annual energy import to 20 % resp. 10 % .
Model details 
- Each municipality has
-
-
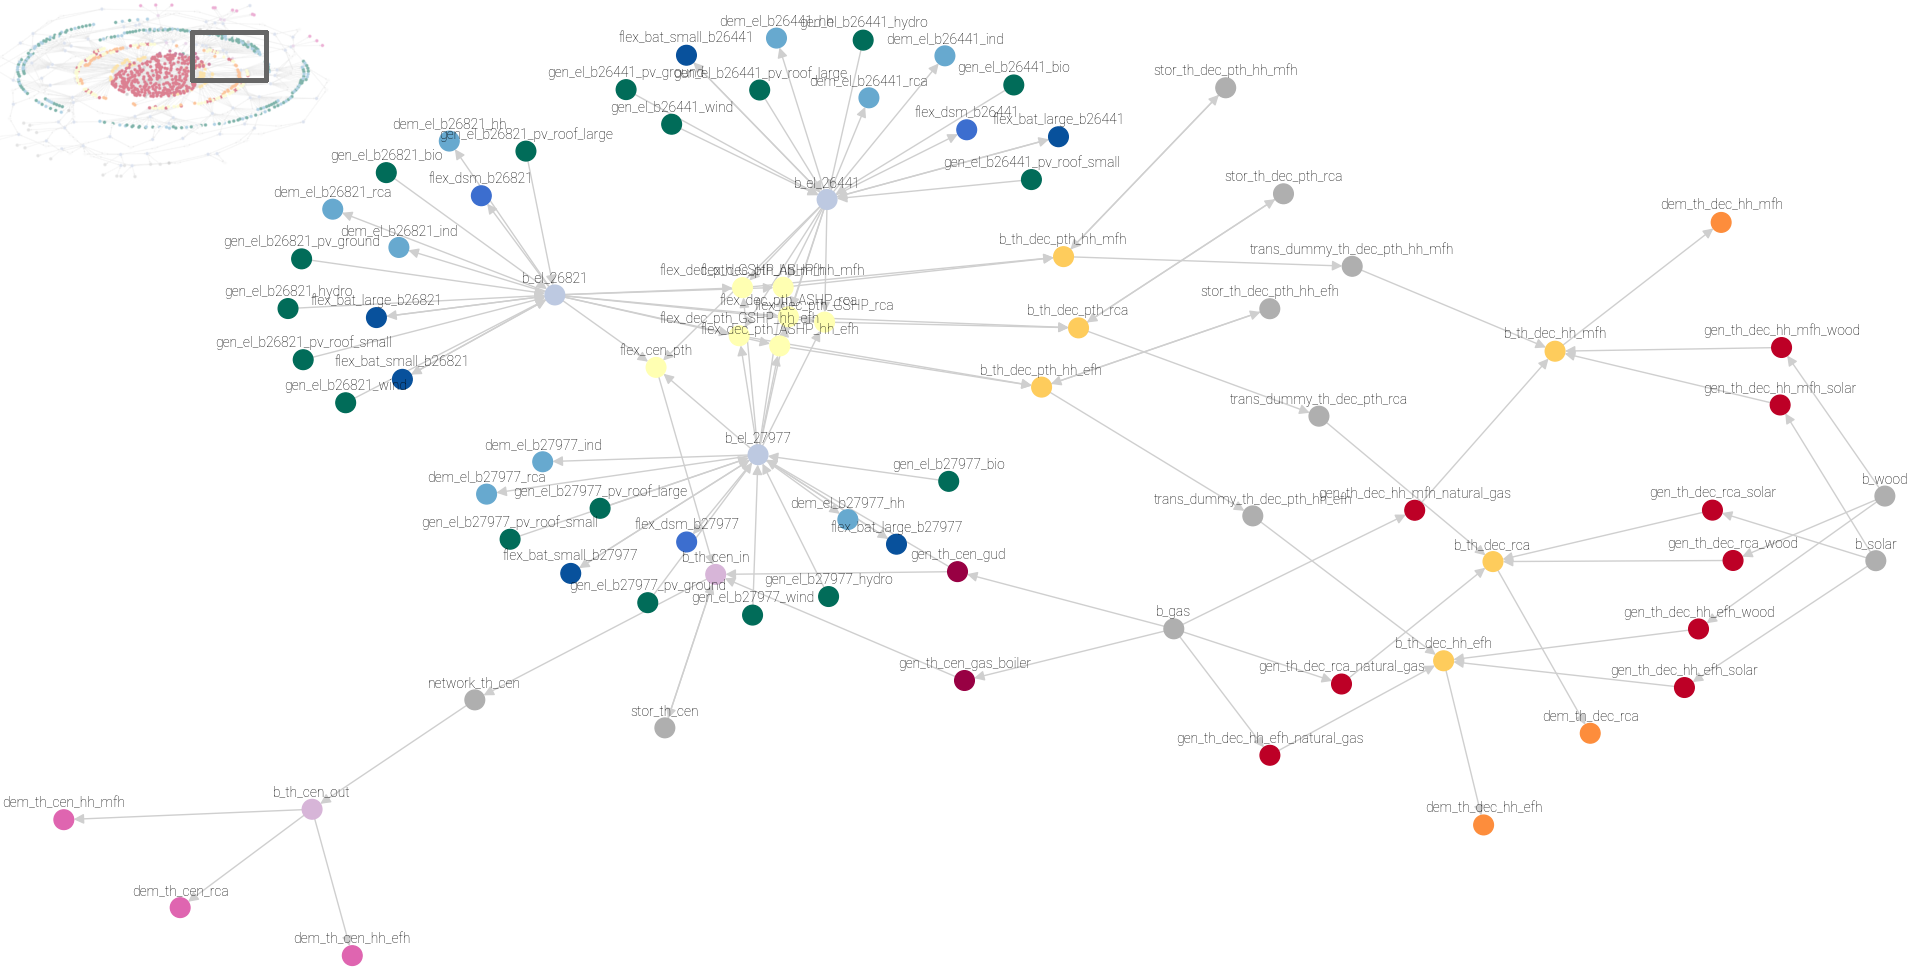
1 bus for decentralized heating
-
1 bus for centralized heating (only municipalities with district heating)
-
n electrical buses, 1 per HV/MV substation (demand and feedin is split equally)
-
The following figure shows the components of one municipality (the full graph is shown in the left top corner) which has 3 electrical buses:
The components’ names and oemof classes used in the model are given in the following table:
|
Component |
oemof type |
Label |
|
|---|---|---|---|
|
electricity |
bus electricity |
Bus |
b_el_{bus_id} |
|
bus electricity import/export |
Bus |
b_el_imex |
|
|
EHV/HV station |
Transformer |
trafo_{id}_b{bus_id0}_b{bus_id1} |
|
|
export |
Sink |
excess_el_{v_level}_b{bus_id} |
|
|
import |
Source |
shortage_el_{v_level}_b{bus_id} |
|
|
line import/export |
Link |
line_b{idx}_b_el_imex |
|
|
line HS |
Link |
line_{line_id}_b{bus_id0}_b{bus_id1} |
|
|
generator EE |
Source |
gen_el_{ags}_b{bus_id}_{tech} |
|
|
generator SCGT Wolfen |
Transformer |
gen_el_{ags}_gas |
|
|
demand |
Sink |
dem_el_{ags}_b{bus_id}_{sector} |
|
|
large-scale batteries |
GenericStorage |
flex_bat_large_{ags}_b{bus_id} |
|
|
home system batteries |
GenericStorage |
flex_bat_small_{ags}_b{bus_id} |
|
|
DSM |
SinkDSM |
flex_dsm_{ags}_b{bus_id} |
|
|
commodities |
bus |
Bus |
b_{energy_source} |
|
energy carrier |
Source |
{energy_source} |
|
|
bus gas |
Bus |
b_gas |
|
|
natural gas-methane mixer |
Transformer |
natural_gas_methane_ratio |
|
|
decentralized heating |
bus |
Bus |
b_th_dec_{ags}_{sector} |
|
generator |
Source |
gen_th_dec_{ags}_{sector}_{energy_source} |
|
|
demand |
Sink |
dem_th_dec_{ags}_{sector} |
|
|
ASHP without storage |
Transformer |
flex_dec_pth_ASHP_nostor_{ags}_{sector} |
|
|
GSHP without storage |
Transformer |
flex_dec_pth_GSHP_nostor_{ags}_{sector} |
|
|
ASHP with storage |
Transformer |
flex_dec_pth_ASHP_stor_{ags}_{sector} |
|
|
GSHP with storage |
Transformer |
flex_dec_pth_GSHP_stor_{ags}_{sector} |
|
|
HP: bus |
Bus |
b_th_dec_pth_{ags}_{sector} |
|
|
HP: storage |
GenericStorage |
stor_th_dec_pth_{ags}_{sector} |
|
|
HP: feedin into dec. heat bus |
Transformer |
trans_dummy_th_dec_pth_{ags}_{sector} |
|
|
district heating |
bus district heating network (in) |
Bus |
b_th_cen_in_{ags} |
|
district heating network |
Transformer |
network_th_cen_{ags} |
|
|
bus district heating network (out) |
Bus |
b_th_cen_out_{ags} |
|
|
generator CCGT Dessau |
ExtractionTurbineCHP |
gen_th_cen_{ags}_gud |
|
|
generator CCGT B-W |
Transformer |
gen_th_cen_{ags}_gud |
|
|
generator gas-fired boiler |
Transformer |
gen_th_cen_{ags}_gas_boiler |
|
|
generator CHP |
Transformer |
gen_th_cen_{ags}_bhkw |
|
|
demand |
Sink |
dem_th_cen_{ags}_{sector} |
|
|
electrical boiler |
Transformer |
flex_cen_pth_{ags} |
|
|
heat storage |
GenericStorage |
stor_th_cen_{ags} |
Note
Details on the topology and components’ parameters can be found in the model’s source code .
Note
The scenario configuration is defined here .