Scenarios 
The scenarios are build along two main dimensions: generation capacity of RES and diffusion of flexibility options. We look at the years 2035 and 2050. Aside from expected generation capacity the pillars also define the characteristics of the demand side.
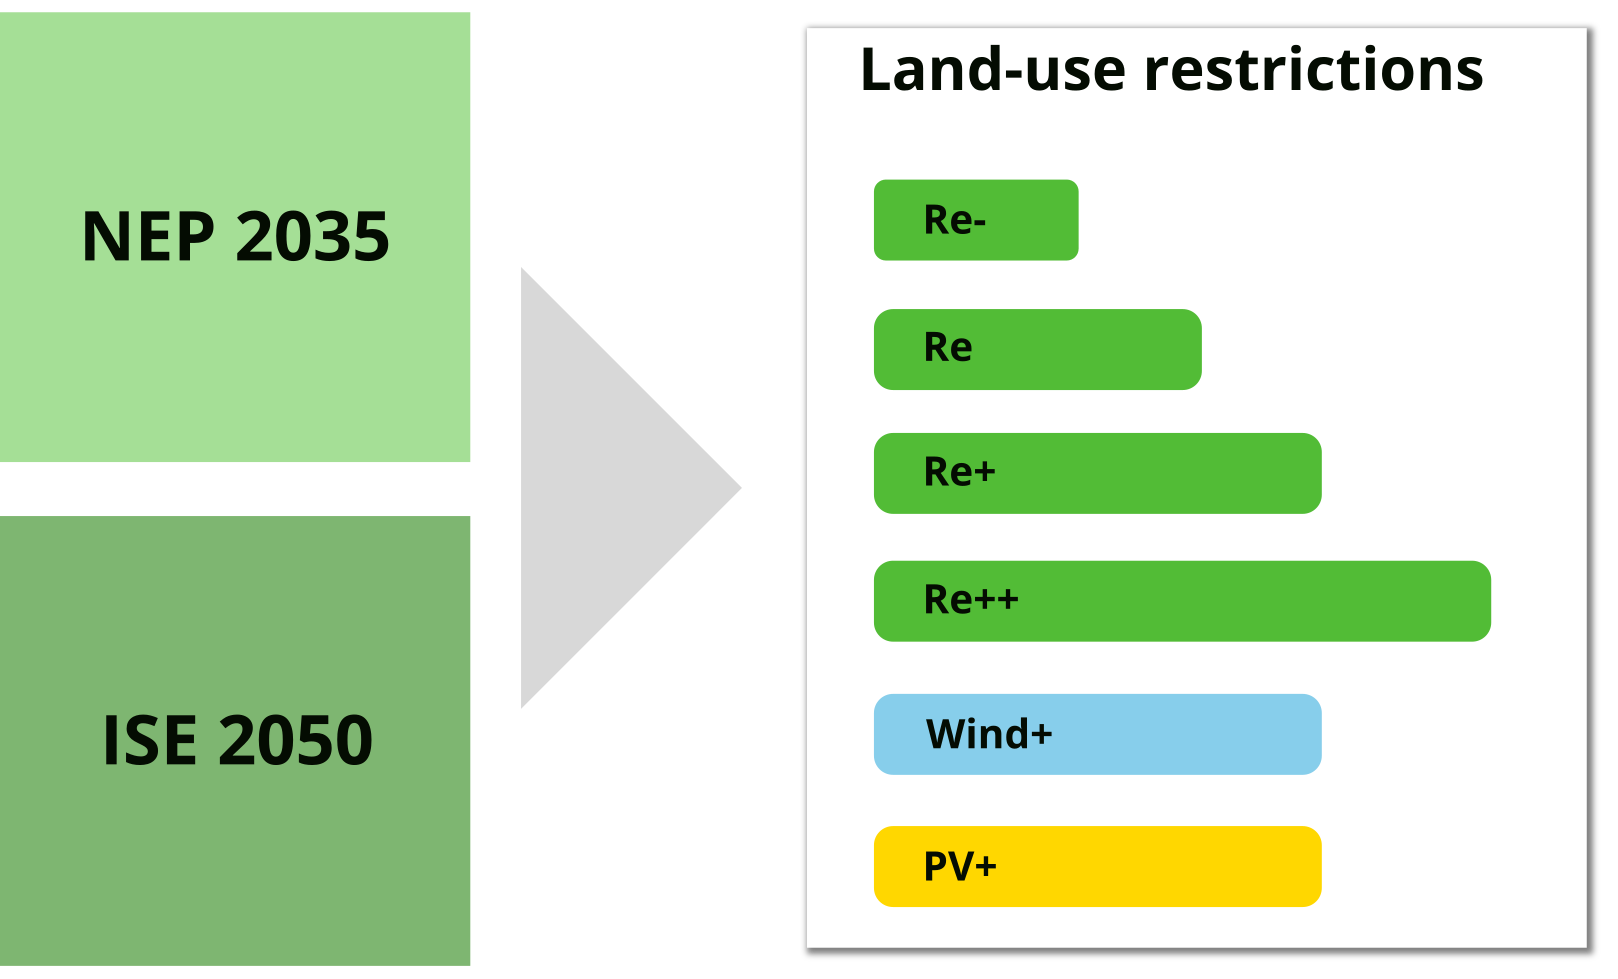
The generation capacity fundamentally derives from two studies. For the year 2035 we follow the assumptions by the Netzentwicklungsplan 2035 (2021) [58] . For the climate neutral scenario, which might be in 2050, the scenarios base on a study by Fraunhofer ISE [59] . For reference and as basis for data preparation of future scenarios NEP and ISE , a scenario for the status quo is defined. Demand and generation is expected to remain the same as in 2017 in this scenario.
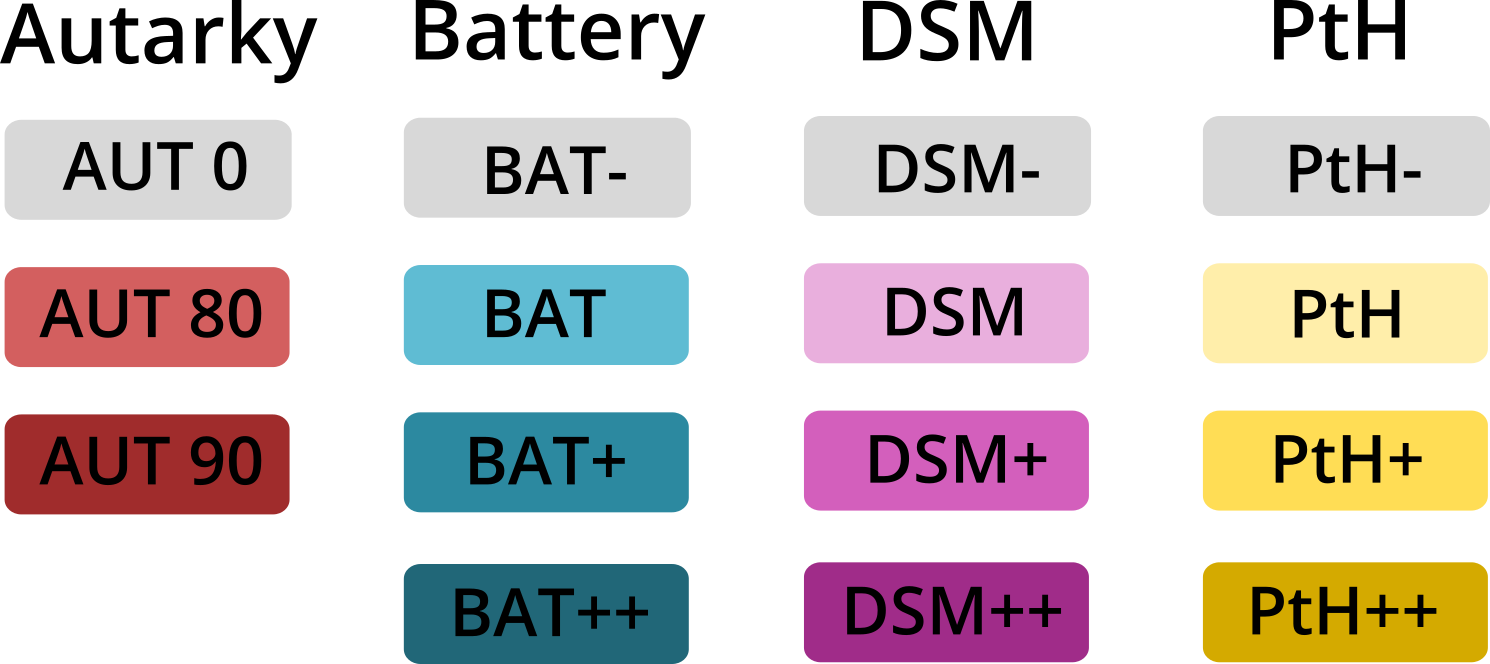
The second main dimension that describe how much flexibility is deployed to the system, splits into four sub-dimensions.
Based on these dimensions, 39 computable scenarios are defined which are described in detail in Scenarios data in detail .
Research questions 
During workshops with stakeholders from the region Anhalt-Bitterfeld-Wittenberg (ABW), important topics related to energy supply where identified. Thereof, the following three research questions resulted:
-
To what extent can the region be supplied by renewables considering the available area?
-
Which degree of autarkic energy supply is realizable in this region?
-
How can new flexibility options support the integration of RES and enhance energy autarky?
Time horizon 
The model includes scenarios for the years 2035 and 2050. Data for describing the status quo is taken mostly from the year 2017. The network development plan [58] provides the basis for defining the scenario for the year 2035. The study of [59] frames the assumptions made for climate neutral scenarios in 2050.
Scenarios data in detail 
Most important parameters that distinguish the individual scenarios are shown below.
|
PV capacity (ground) [MW] |
PV capacity (rooftop) [MW] |
Wind capacity [MW] |
Autarky level [minimum % of demand] |
Demand-Side Management [% of households] |
Battery storage (large) [MWh] |
Battery storage (PV storage) [MWh] |
Dec. heating systems with storage [%] |
Thermal storage (district heating) [MWh/MW] |
|
|---|---|---|---|---|---|---|---|---|---|
|
StatusQuo |
445 |
95 |
717 |
0 |
0 |
0 |
0 |
71 |
0 |
|
NEP_RE- |
1288 |
206 |
750 |
0 |
0 |
0 |
0 |
71 |
0 |
|
NEP_RE-_DSM |
1288 |
206 |
750 |
0 |
21 |
0 |
0 |
71 |
0 |
|
NEP_RE-_DSM+ |
1288 |
206 |
750 |
0 |
28 |
0 |
0 |
71 |
0 |
|
NEP_RE-_BAT |
1288 |
206 |
750 |
0 |
0 |
200 |
0 |
71 |
0 |
|
NEP_RE-_BAT+ |
1288 |
206 |
750 |
0 |
0 |
710 |
60 |
71 |
0 |
|
NEP_RE-_PTH |
1288 |
206 |
750 |
0 |
0 |
0 |
0 |
71 |
5 |
|
NEP_RE-_PTH+ |
1288 |
206 |
750 |
0 |
0 |
0 |
0 |
100 |
10 |
|
NEP_RE-_DSM_BAT_PTH |
1288 |
206 |
750 |
0 |
21 |
200 |
0 |
71 |
5 |
|
NEP_RE-_DSM+_BAT+_PTH+ |
1288 |
206 |
750 |
0 |
28 |
710 |
60 |
100 |
10 |
|
NEP_RE-_AUT80_DSM_BAT_PTH |
1288 |
206 |
750 |
80 |
21 |
200 |
0 |
71 |
5 |
|
NEP_RE-_AUT80_DSM+_BAT+_PTH+ |
1288 |
206 |
750 |
80 |
28 |
710 |
60 |
100 |
10 |
|
NEP_RE-_AUT90_DSM_BAT_PTH |
1288 |
206 |
750 |
90 |
21 |
200 |
0 |
71 |
5 |
|
NEP_RE-_AUT90_DSM+_BAT+_PTH+ |
1288 |
206 |
750 |
90 |
28 |
710 |
60 |
100 |
10 |
|
NEP |
1268 |
206 |
1237 |
0 |
0 |
0 |
0 |
71 |
0 |
|
NEP_DSM_BAT_PTH |
1268 |
206 |
1237 |
0 |
21 |
200 |
0 |
71 |
5 |
|
NEP_AUT90_DSM_BAT_PTH |
1268 |
206 |
1237 |
90 |
21 |
200 |
0 |
71 |
5 |
|
NEP_DSM+_BAT+_PTH+ |
1268 |
206 |
1237 |
0 |
28 |
710 |
60 |
100 |
10 |
|
NEP_WIND+_DSM_BAT_PTH |
1268 |
206 |
1840 |
0 |
21 |
200 |
0 |
71 |
5 |
|
NEP_WIND+_DSM+_BAT+_PTH+ |
1268 |
206 |
1840 |
0 |
28 |
710 |
60 |
100 |
10 |
|
NEP_PV+_DSM_BAT_PTH |
3165 |
560 |
1237 |
0 |
21 |
200 |
0 |
71 |
5 |
|
NEP_PV+_DSM+_BAT+_PTH+ |
3165 |
560 |
1237 |
0 |
28 |
710 |
60 |
100 |
10 |
|
NEP_RE++_DSM_BAT_PTH |
4246 |
1125 |
3095 |
0 |
21 |
200 |
0 |
71 |
5 |
|
ISE_RE- |
1610 |
803 |
750 |
0 |
0 |
0 |
0 |
71 |
0 |
|
ISE_RE-_DSM |
1610 |
803 |
750 |
0 |
40 |
0 |
0 |
71 |
0 |
|
ISE_RE-_DSM+ |
1610 |
803 |
750 |
0 |
48 |
0 |
0 |
71 |
0 |
|
ISE_RE-_BAT |
1610 |
803 |
750 |
0 |
0 |
2400 |
0 |
71 |
0 |
|
ISE_RE-_BAT+ |
1610 |
803 |
750 |
0 |
0 |
3250 |
240 |
71 |
0 |
|
ISE_RE-_PTH |
1610 |
803 |
750 |
0 |
0 |
0 |
0 |
71 |
5 |
|
ISE_RE-_PTH+ |
1610 |
803 |
750 |
0 |
0 |
0 |
0 |
100 |
10 |
|
ISE_RE-_DSM_BAT_PTH |
1610 |
803 |
750 |
0 |
40 |
2400 |
0 |
71 |
5 |
|
ISE_RE-_DSM+_BAT+_PTH+ |
1610 |
803 |
750 |
0 |
48 |
3250 |
240 |
100 |
10 |
|
ISE_RE-_AUT80_DSM_BAT_PTH |
1610 |
803 |
750 |
80 |
40 |
2400 |
0 |
71 |
5 |
|
ISE_RE-_AUT80_DSM+_BAT+_PTH+ |
1610 |
803 |
750 |
80 |
48 |
3250 |
240 |
100 |
10 |
|
ISE_RE-_AUT90_DSM++_BAT++_PTH++ |
1610 |
803 |
750 |
90 |
80 |
20000 |
400 |
100 |
10 |
|
ISE |
3716 |
803 |
2694 |
0 |
0 |
0 |
0 |
71 |
0 |
|
ISE_DSM_BAT_PTH |
3716 |
803 |
2694 |
0 |
40 |
2400 |
0 |
71 |
5 |
|
ISE_DSM+_BAT+_PTH+ |
3716 |
803 |
2694 |
0 |
48 |
3250 |
240 |
100 |
10 |
|
ISE_RE++_DSM_BAT_PTH |
5308 |
1374 |
3095 |
0 |
40 |
2400 |
0 |
71 |
5 |
Note
The scenario ISE_RE-_AUT90_DSM_BAT_PTH is not listed here, because it creates an infeasible optimization problem. This scenario replicates assumptions made in ISE_RE-_AUT80_DSM_BAT_PTH except for the limit on electricity supply from the national grid which is further reduced to 10 %.
How these scenarios are constructed and how parameters are determined is described for each scenario dimension in the subsections below.
Renewable energy installations (RE) 
Capacity of renewable energy sources (RES) is taken from studies investigating future energy supply of Germany. Based on an in-depth analysis of available sites for RES installations, the capacity is further restricted. See Land eligibility for RE for a detailed analysis of the restriction areas.
For estimating the future RES capacity in the region Anhalt-Bitterfeld-Wittenberg (and in the individual municipalities), a prox-to-now approach is used. This means, the national increase of RES generation capacity is disaggregated to each municipality by the existing capacity. For example, a 80 % increase of PV generation capacity at national level translates to an increase of PV capacity for each municipality by 80 % of the existing capacity. Thereby, the maximum available land is respected and in case of not sufficient space in one municipality, exceeding capacitiy is located in a neighboring municipality.
Details of the disaggregation of RES capacity for each of the options along the scenario dimension RES capacity are explained in the following two tables.
NEP 
Capacity in the “NEP scenarios” is build upon [58] .
|
Title |
Wind energy |
PV ground mounted |
PV rooftop |
|
|---|---|---|---|---|
|
RE- |
Legal status quo (2017) |
Capacity limited to designated areas for wind energy (VR/EG). |
Areas along highways and railway tracks and 0.1 % of agricultural land (strict and weak restrictions apply). |
Capacity according to NEP. |
|
none |
NEP |
Capacity according to NEP. |
Capacity according to NEP. |
Capacity according to NEP. |
|
WIND+ |
Increased wind |
Minimum distance to settlements reduced to 500 m and wind installations in forests not allowed. |
Capacity according to NEP. |
Capacity according to NEP. |
|
PV+ |
Increased PV |
Capacity according to NEP. |
Areas along highways and railway tracks and 1.0 % of agricultural land (strict and weak restrictions apply). |
Usage of 50 % of available roof area. |
|
RE++ |
Highly increased wind+PV |
Minimum distance of wind energy converters to settlements reduced to 500 m and wind installations in forests allowed. |
Areas along highways and railway tracks and 1.0 % of agricultural land (only strict restrictions apply). |
Usage of 100 % of available roof area. |
ISE 
Capacity in the “ISE scenarios” is build upon [59] .
|
Title |
Wind energy |
PV ground mounted |
PV rooftop |
|
|---|---|---|---|---|
|
RE- |
Legal status quo (2017) |
Capacity limited to designated areas for wind energy (VR/EG). |
Areas along highways and railway tracks and 0.1 % of agricultural land (strict and weak restrictions apply). |
Capacity according to ISE. |
|
none |
ISE |
Capacity according to ISE. |
Capacity according to ISE. |
Capacity according to ISE. |
|
RE++ |
Highly increased wind+PV |
Minimum distance of wind energy converters to settlements reduced to 500 m and wind installations in forests allowed. |
Areas along highways and railway tracks and 1.0 % of agricultural land (only strict restrictions apply). |
Usage of 100 % of available roof area. |
Demand-side management (DSM) 
The number of households equipped with DSM infrastructure (devices and ICT) is varied. The numbers used in each scenario variation are derived from [94] . They estimate the numbers of households that are being equipped with DSM by technical feasibility (German: Realisierbarkeitsfaktor ) and user-side acceptance (German: Akzeptanzfaktor). Values for the year 2035 (NEP) are estimated applying a linear interpolation.
NEP 
Parameters applied for “NEP scenarios”.
|
Description |
|
|---|---|
|
none |
No demand-side management considered in households. |
|
DSM |
21 % of households are considered to be equipped with DSM devices and control and communication infrastructure. |
|
DSM+ |
28 % of households are considered to be equipped with DSM devices and control and communication infrastructure. |
ISE 
Parameters applied for “ISE scenarios”.
|
Description |
|
|---|---|
|
none |
No demand-side management considered in households. |
|
DSM |
40 % of households are considered to be equipped with DSM devices and control and communication infrastructure. |
|
DSM+ |
48 % of households are considered to be equipped with DSM devices and control and communication infrastructure. |
|
DSM++ |
80 % of households are considered to be equipped with DSM devices and control and communication infrastructure. |
Battery storage capacity 
The battery storage capacity is determined by scaling with installed RES capacity. The ratio between battery storage capacity and RES generation capacity is taken from [58] . This is also applied to ISE-scenarios using the same ratio, but RES generation capacity from [59] . Spatial allocation of battery storage capacity follows the same idea down to municipality level.
|
Description |
|
|---|---|
|
none |
No battery storage capacity considered for balancing at system level. Existing PV home storage systems are neglected |
|
BAT |
Battery storage capacity by plain scaling of battery storage capacity by RES capacity of particular generation capacity data in the scenario |
|
BAT+ |
Increased capacity compared to BAT using max. available RES capacity in the region. |
|
BAT++ |
Largely increased capacity compared to BAT+. Applies to scenario ISE_RE-_AUT90_DSM++_BAT++_PTH++ only to allow for 90 percent autarky |
Power-to-heat 
By 2035, for the NEP scenario, it is assumed that 15 % of the total heat demand is supplied by heat pumps. For the climate neutral scenario in 2050 it is estimated that 70 % of the total heat demand is covered by heat supply from heat pumps. The inherent thermal storage capacity induced by pipes in decentral heating systems is assumed with 20 l/kW of installed heat pump power according to suggestions by the manufacturer Viessmann [75] . The additional heat storage capacity for buffering (which provides flexibility) is estimated with 60 l/kW of installed heat pump power. For the scenarios PTH+ and PTH++ an increased heating storage capacity for heating systems equipped with heat pumps is assumed. Total heat storage capacity is given in brackets in the table below.
|
Description |
|
|---|---|
|
none |
No additional thermal storage capacity beyond inherent storage capacity of pipes of the decentral heating system. No storage capacity in district heating systems. |
|
PTH |
71 % of decentral heating systems equipped with storages (74.2 l/kW of heat pump). 5 MW storage capacity in district heating systems. |
|
PTH+ |
100 % of decentral heating systems equipped with storages (114.2 l/kW of heat pump). 10 MW storage capacity in district heating systems. |
|
PTH++ |
100 % of decentral heating systems equipped with storages (228.4 l/kW of heat pump). 10 MW storage capacity in district heating systems. |
Autarky 
With the scenario dimension autarkic supply, it is investigated how region’s energy demand can be supplied under constrained imports of electricity. Autarky on annual balance of 80 % and 90 % is analyzed based in the in-depth investigation of regional autarky in RES based electricity supply by [76] .
|
Description |
|
|---|---|
|
none |
No restrictions on electricity supply from national system. |
|
AUT80 |
Annual electricity demand supplied from national system limited to 20 % (80 % of demand is supplied locally). |
|
AUT90 |
Annual electricity demand supplied from national system limited to 10 % (90 % of demand is supplied locally). |
Note
Further modelling details and assumptions are described in Energy system model .